Set up MI Analytics
Note
- This solution is recommended only for users who are using ESB EI 7.0.0 and want to migrate in to a newer version while retaining the already existing analytics data.
How it works
MI Analytics consists of two components: Server and Portal. The server processes the data streams that are sent from the Micro Integrator and publishes the statistics to a database. The portal reads the statistics published by the worker and displays the statistics. The server and portal are connected through the database.
Follow the instructions given below to enable Analytics in the Micro Integrator profile.
System requirements
You will be running three servers (Analytics server, MI Analytics portal, and the Micro Integrator) for this solution. Be sure that you have the required system specifications to run each server.
More information on the system requirements
For the Analytics Server:
Memory - ~ 4 GB per worker node
- It is recommended to allocate 4 cores.
- ~ 2 GB is the initial heap (-Xms) required for the server startup. The maximum heap size is 4 GB (-Xmx)
Disk - ~ 480 MB, excluding space allocated for log files and databases.
For the Analytics Portal:
Memory - ~ 2 GB minimum, 4 GB Maximum
- 2 CPU cores minimum. It is recommended to allocate 4 cores.
- ~ 512 MB heap size. This is generally sufficient to process typical SOAP messages but the requirements vary with larger message sizes and the number of messages processed concurrently.
Disk - ~ 480 MB, excluding space allocated for log files and databases.
For the Micro Integrator, see the installation prerequsites.
Step 1 - Download the servers
-
Download Integrator Analytics.
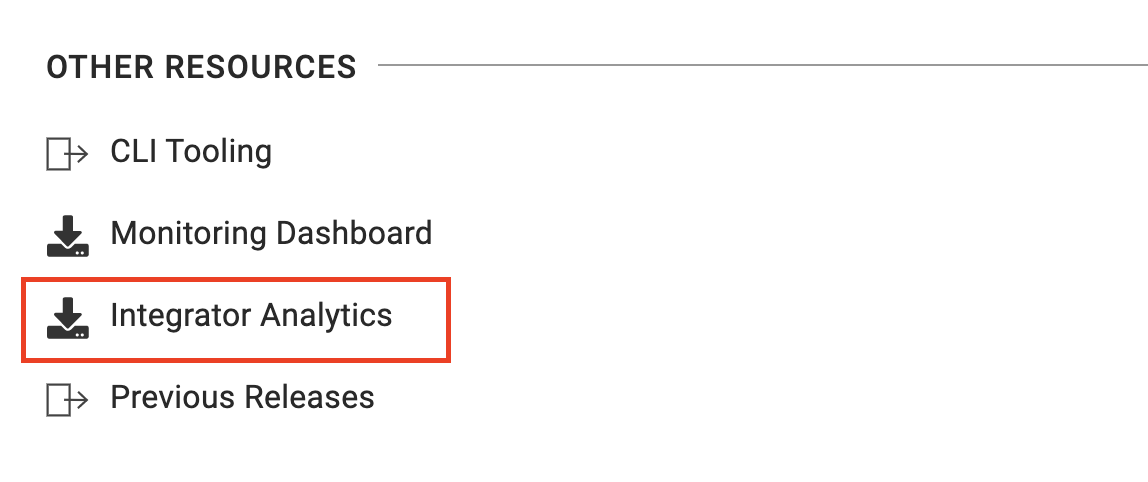
- Go to the ESB Enterprise Integrator product page, click TRY IT NOW, and then go to the Other Resources section.
-
Click Integration Analytics to download the distribution.
Info
The location of your Analytics installation will be referred to as
<MI_ANALYTICS_HOME>. -
Download and install the Micro Integrator.
Step 2 - Configure the Micro Integrator
Step 2.1 - Enable statistics monitoring
To enable statistics monitoring for the Micro Integrator, add the following parameters in the deployment.toml file of your Micro Integrator. This file is stored in the <MI_HOME>/conf.
[mediation]
flow.statistics.enable=true
stat.tracer.collect_payloads=true
stat.tracer.collect_mediation_properties=true
Step 2.2 - Enable data publishing to MI Analytics
Follow the instructions below to configure the Micro Integrator to publish data to MI Analytics. Analytics publishing can be configured in the [monitoring] section of the <MI_HOME>/conf/deployment.toml file as shown below.
Note
By default, the Micro Integrator is internally configured (with the following) to connect with an Integrator Analytics server running on the same Virtual Machine (VM). To change the default setup, you need to add the following to the deployment.toml file and update the values.
[monitoring]
ei_analytics.server_url = "tcp://localhost:7612"
ei_analytics.auth_server_url = "ssl://localhost:7712"
ei_analytics.username = "admin"
ei_analytics.password = "admin"
If the Analytics nodes run in cluster mode or in different VMs, you can configure the ei_analytics.server_url and the ei-analytics.auth_server_url parameters in a load balancing manner. For more information, see, Set up load balancing.
Step 2.3 - Optionally, enable statistics for ALL artifacts
If you want to collect statistics for all your integration artifacts, be sure to add the following parameter under the [mediation] header in the deployment.toml file in addition the parameters explained above:
flow.statistics.capture_all=trueAlternatively, you can enable statistics for selected artifacts as explained below.
Step 2.4 - Optionally, enable statistics for specific artifacts
Let's use the integration artifacts from the service chaining tutorial.
Warning
It is not recommended to enable tracing in production environments as it generates a large number of events that reduces the performance of the analytics profile. Therefore, tracing should only be enabled in development environments.
If you do not have the integration artifacts from the service chaining tutorial
If you did not try the service chaining tutorial yet:
- Download the pre-packaged project for the service chaining use case.
- Open ESB Integration Studio and import the pre-packaged project.
REST API artifact
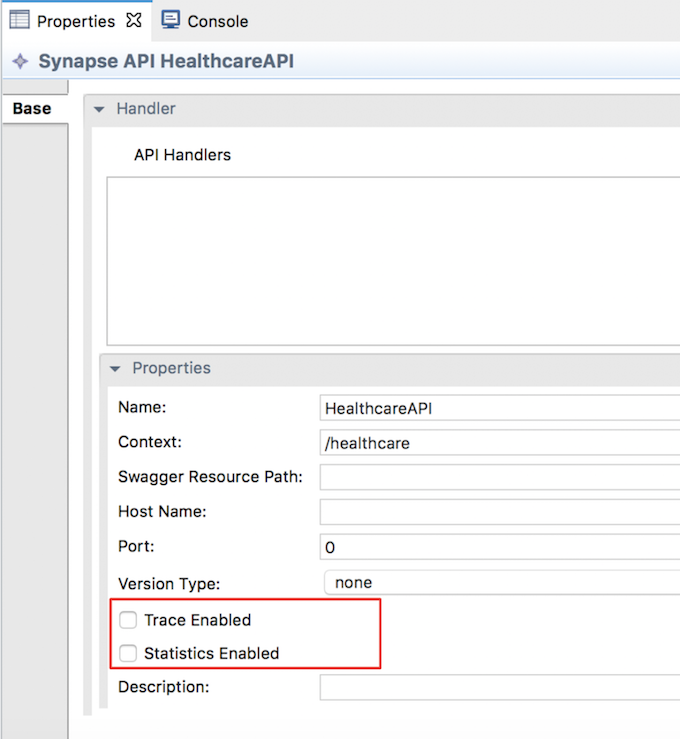
Follow the steps below to enable statistics and tracing for the REST API artifact:
- Select
HealthcareAPIin the canvas of ESB Integration Studio to open the Properties tab. -
Select Statistics Enabled and (if required) Trace Enabled as shown below.
Endpoint artifacts
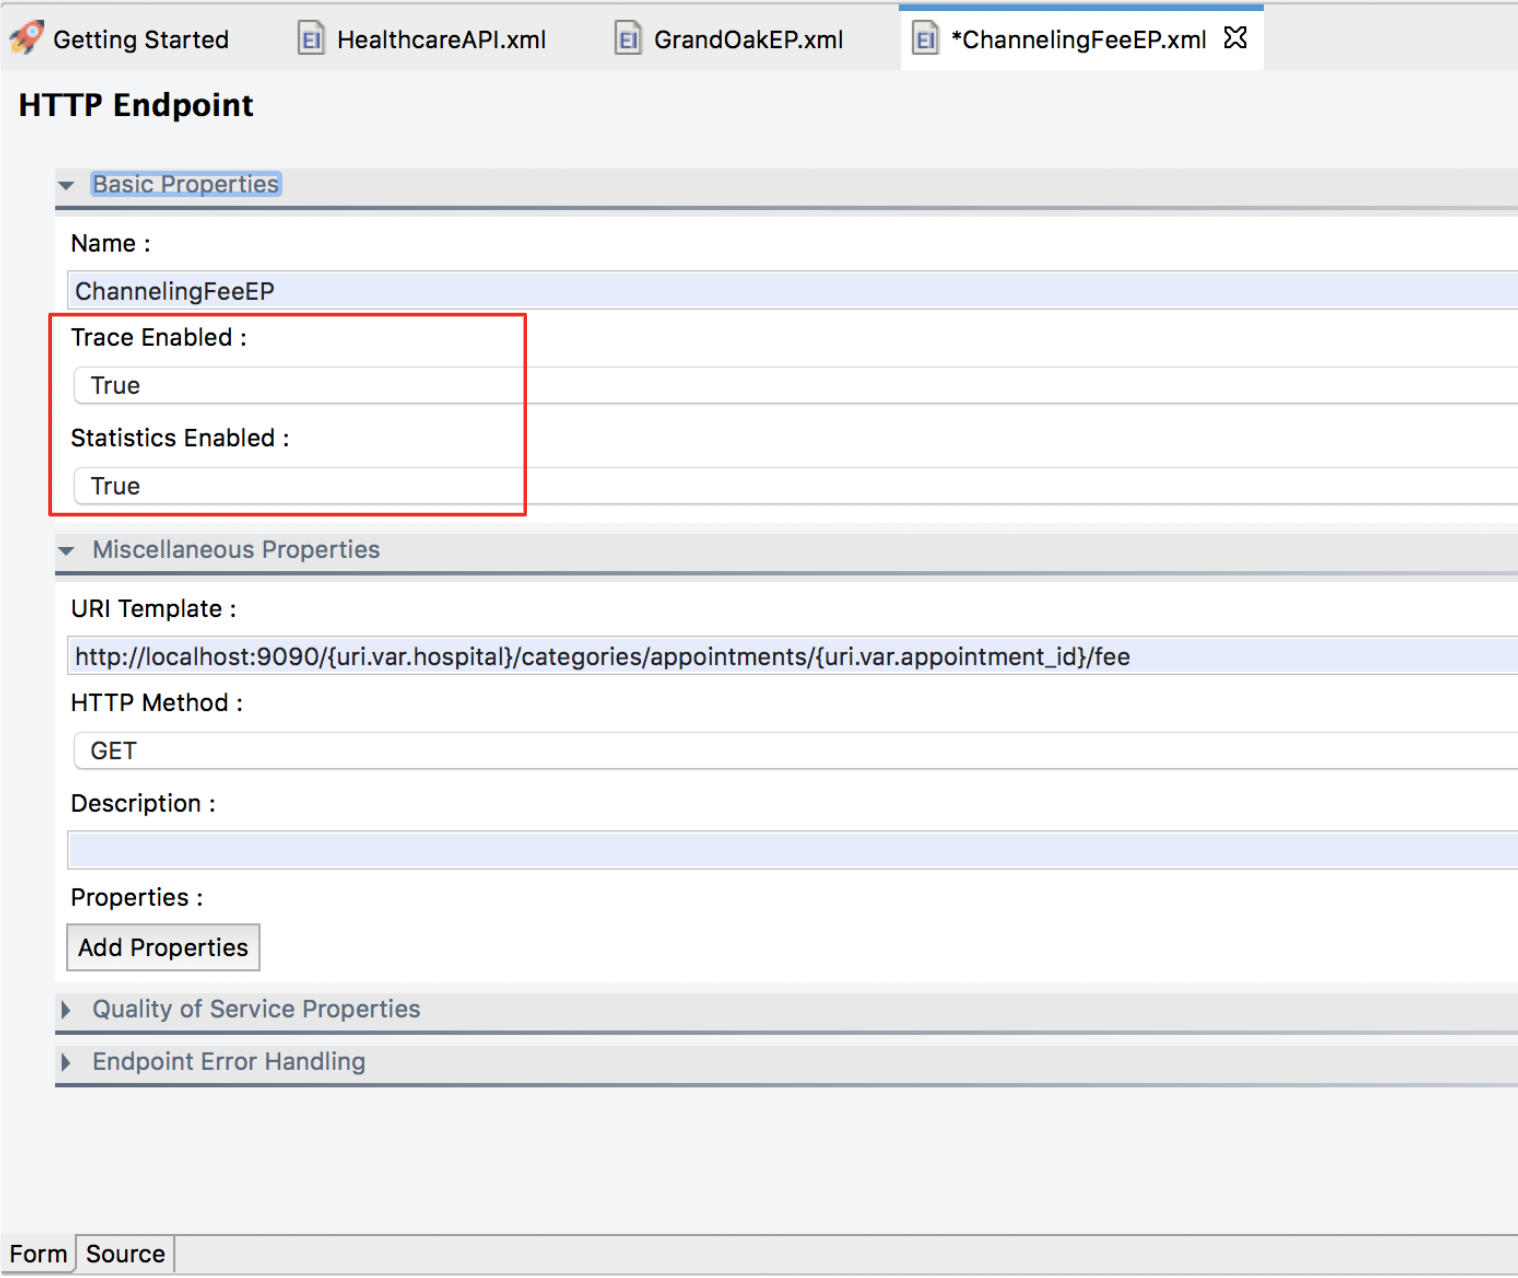
Follow the steps below to enable statistics for the endpoint artifacts:
- Select the required endpoint artifacts from the project explorer.
- Select Statistics Enabled and (if required) Trace Enabled as shown below.
Step 2.5 - Optionally, set up load balancing
You can send events to multiple Analytics servers either by sending the same event to many Analytics servers or by load balancing events among a set of servers. This handles the failover problem. When events are load balanced within a set of servers and if one receiver cannot be reached, events are automatically sent to the other available and active Analytics servers.
Load balancing across a group of servers
To configure this setup, configure the Analytics receiver URL specified in the Micro Integrator as a comma-separated list of Analytics servers.
The format of the receiver URL should be as follows:
tcp://<Analytics-1>:<port>,tcp://<Analytics-2>:<port>,tcp://<Analytics-3>:<port>Example configuration in the deployment.toml file of the Micro Integrator:
[monitoring]
ei_analytics.server_url = "tcp://10.100.2.32:7611, tcp://10.100.2.33:7611, tcp://10.100.2.34:7611"
ei_analytics.auth_server_url = "tcp://10.100.2.32:7612, tcp://10.100.2.33:7612, tcp://10.100.2.34:7612"
ei_analytics.username = "admin"
ei_analytics.password = "admin"
This handles failover as follows:
- If Analytics Receiver-1 is marked as down, then the Micro Integrator will send the data only to Analytics Receiver-2 and Analytics Receiver-3 in a round robin manner.
- When the Analytics Receiver-1 becomes active after some time, the Micro Integrator automatically detects it, adds it to the operation, and again starts to load balance between all three receivers. This functionality significantly reduces the loss of data and provides more concurrency.
Load balancing across multiple groups of servers
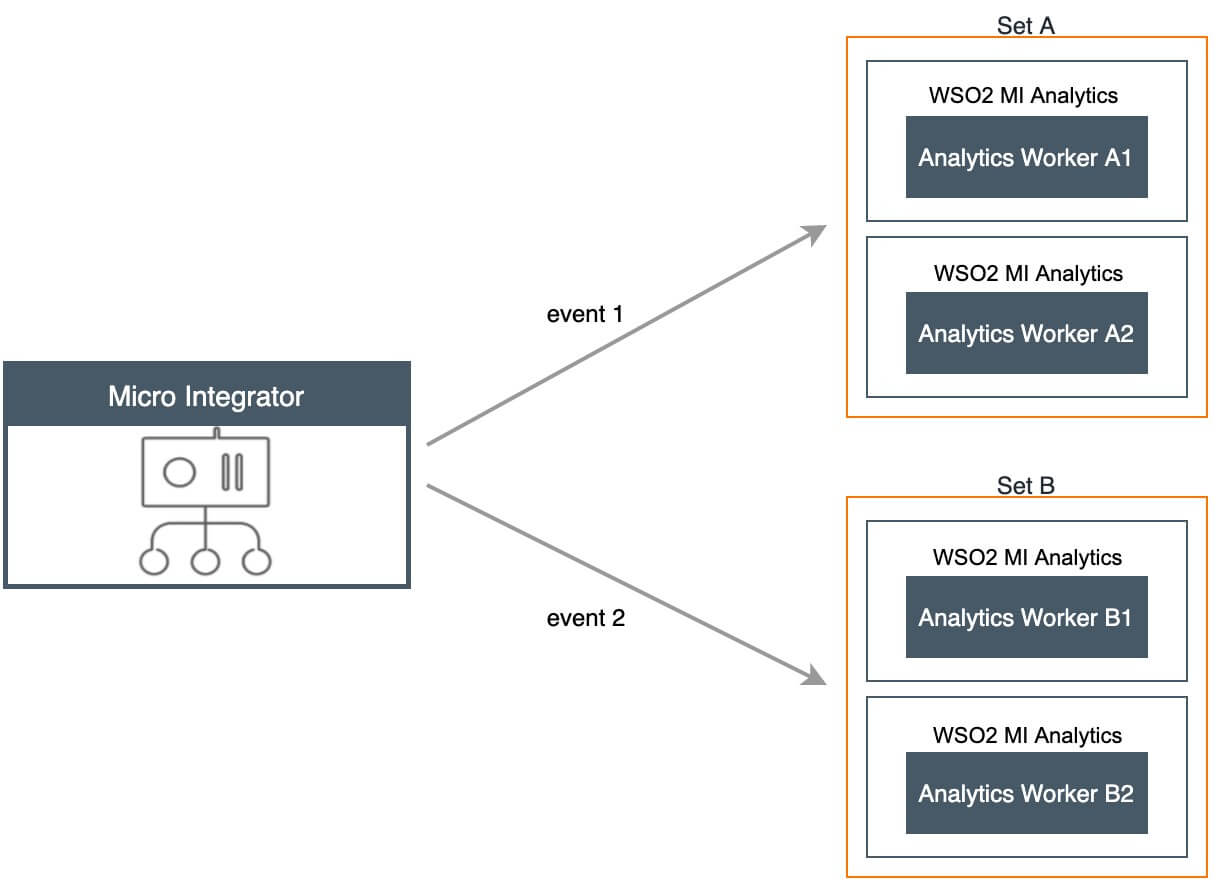
In this setup, there are two sets of servers that are referred to as set-A and set-B. You can send events to both the sets. You can also carry out load balancing for both sets as mentioned in Load balancing across a group of servers. This scenario is a combination of load balancing between a set of servers and sending an event to several receivers.
- An event is sent to both set-A and set-B.
- Within set-A, it is sent either to Analytics A1 or Analytics A2.
- Similarly within set-B, it is sent either to Analytics B1 or Analytics B2.
-
In the setup, you can have any number of sets and any number of servers as required.
Similar to the other scenarios, you need to describe the server URLs as the receiver URL in the Micro Integrator configuration. The sets should be specified within curly braces separated by commas. Furthermore, each receiver that belongs to the set should be within the curly braces and with the receiver URLs in a comma-separated format.
The format of the receiver URL should be as follows:
{tcp://Analytics-A1:port, tcp://Analytics-A2:port},{tcp://Analytics-B1:port, tcp://Analytics-B2:port}Example configuration in the deployment.toml file of the Micro Integrator:
[monitoring]
ei_analytics.server_url = "{tcp://10.100.2.32:7611, tcp://10.100.2.33:7611}, {tcp://10.100.2.34:7611, tcp://10.100.2.35:7611}"
ei_analytics.auth_server_url = "{tcp://10.100.2.32:7612, tcp://10.100.2.33:7612}, {tcp://10.100.2.34:7612, tcp://10.100.2.35:7612}"
ei_analytics.username = "admin"
ei_analytics.password = "admin"
Sending all events to several analytics servers
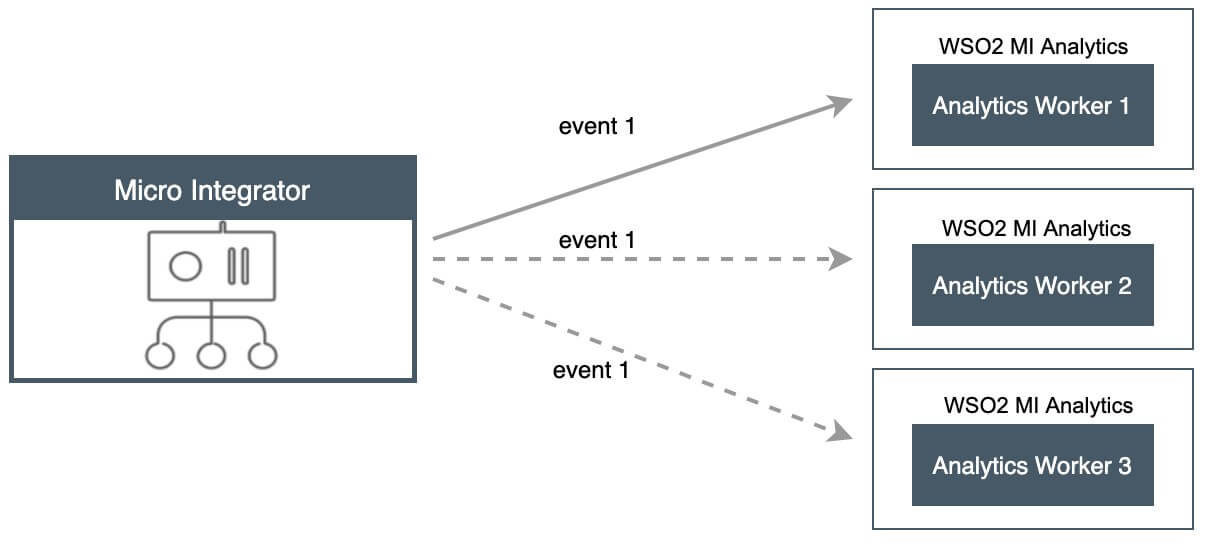
This setup involves sending all the events to more than one Analytics server. This approach is useful when you want to have multiple Analytics servers to analyze the same events simultaneously. For example, as shown below, you can configure the Micro Integrator to publish the same event to both Analytics servers at the same time.
The Analytics receiver URL should be configured with the following format in the Micro Integrator:
{tcp://Analytics-1>:<port>}, {tcp://Analytics-2>:<port>}, {tcp://<Analytics-3>:<port>}Example configuration in the deployment.toml file of the Micro Integrator:
[monitoring]
ei_analytics.server_url = "{tcp://10.100.2.32:7611},{ tcp://10.100.2.33:7611}, {tcp://10.100.2.34:7611}"
ei_analytics.auth_server_url = "{tcp://10.100.2.32:7612},{ tcp://10.100.2.33:7612}, {tcp://10.100.2.34:7612}"
ei_analytics.username = "admin"
ei_analytics.password = "admin"
Failover configuration
When using the failover configuration in publishing events to Analytics, events are sent to multiple Analytics servers in a sequential order based on priority. You can specify multiple Analytics servers so that events can be sent to the next server in the specified sequence (in a situation where they were not successfully sent to the first server).
In the scenario depicted in the image below, - The events are first sent to Analytics-1. - If it is unavailable, then events are sent to Analytics-2. - If Analytics-2 is also unavailable, then the events are sent to Analytics-3.
The Analytics receiver URL should be configured with the following format in the Micro Integrator:
tcp://<Analytics-1>:<port>|tcp://<Analytics-2>:<port>|tcp://<Analytics-3>:<port>[monitoring]
ei_analytics.server_url = "tcp://10.100.2.32:7611|tcp://10.100.2.33:7611|tcp://10.100.2.34:7611"
ei_analytics.auth_server_url = "tcp://10.100.2.32:7612|tcp://10.100.2.33:7612|tcp://10.100.2.34:7612"
ei_analytics.username = "admin"
ei_analytics.password = "admin" What's Next?
If you have successfully set up your analytics deployment, see the instructions on using the analytics portal.
Top

