Monitoring with OpenTelemetry
MWARE ESB supports a deployment architecture that has distributed components. As a result, tracing a message is important to debug and observe a message path so that you know where it originates. This setup is known as distributed tracing. OpenTelemetry allows you to enable distributed tracing for MWARE ESB.
OpenTelemetry is a single set of APIs and libraries that standardize how telemetry data such as traces, metrics and logs are collected, transmitted and managed. It provides a secure, vendor-neutral specification for instrumentation and offers a way for developers to follow the thread — to trace requests from beginning to end across touchpoints and understand distributed systems at scale. OpenTelemetry will also help to trace the message and identify the latencies that took place in each process or method. Thereby, OpenTelemetry will help you to carry out a time-related analysis, allowing for a multitude of ways to retrieve instrumented data. These are listed below:
- Jaeger
- Zipkin
- Log
- OTLP
For more information, see OpenTelemetry Configurations.
Note
At a time, only one of the below types can be enabled.
Enabling Jaeger Tracing
-
Copy the following configuration into the
deployment.tomlfile.[apim.open_telemetry] remote_tracer.enable = true remote_tracer.name = "jaeger" remote_tracer.hostname = "<hostname-of-jaeger-endpoint>" remote_tracer.port = "<port-of-jaeger-endpoint>"[apim.open_telemetry] remote_tracer.enable = true remote_tracer.name = "jaeger" remote_tracer.hostname = "localhost" remote_tracer.port = 14250 -
Start the server.
After you invoke the APIs you will see the tracing data in Jaeger as follow:

Enabling Zipkin Tracing
-
Copy the following configuration into the
deployment.tomlfile.[apim.open_telemetry] remote_tracer.enable = true remote_tracer.name = "zipkin" remote_tracer.hostname = "<hostname-of-zikin-endpoint>" remote_tracer..port = "<port-of-zipkin-endpoint>"[apim.open_telemetry] remote_tracer.enable = true remote_tracer.name = "zipkin" remote_tracer.hostname = "localhost" remote_tracer.port = 9411 -
Start the server.
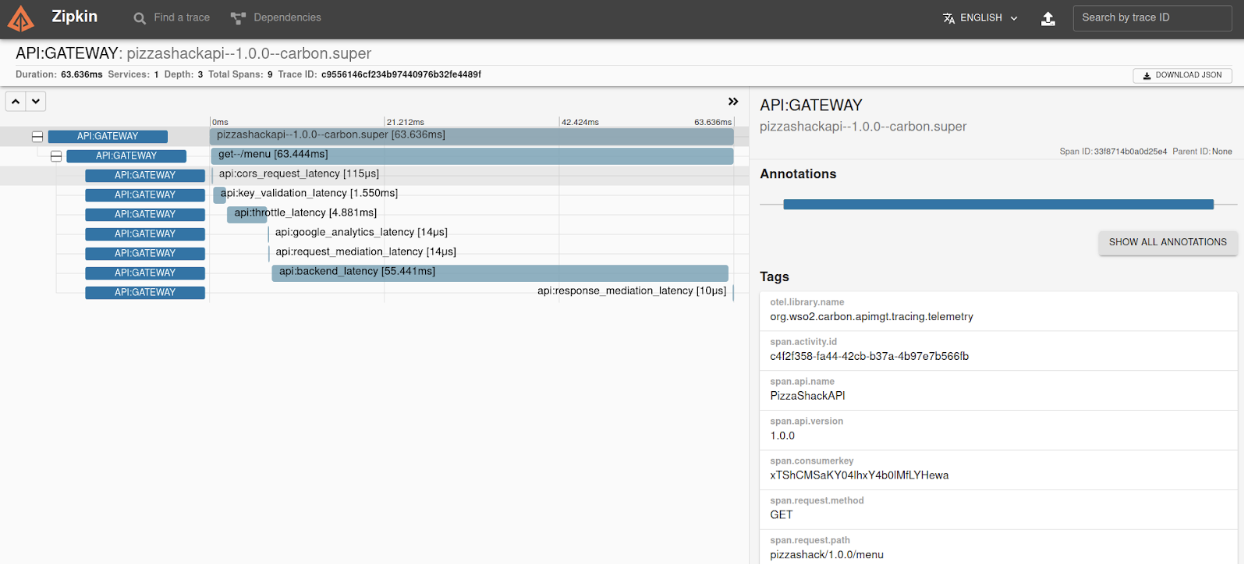
After you invoke the APIs you will see the tracing data in Zipkin as follow:
Enabling Log Tracing
-
Copy the following configuration into the
deployment.tomlfile.[apim.open_telemetry] remote_tracer.enable = false log_tracer.enable = true -
Start the server.
After you invoke the APIs you will be able to see tracing data in the
wso2-apimgt-open-tracing.login the<API-M_HOME>/repository/logsfolder.
12:54:29,882 [-] [BatchSpanProcessor_WorkerThread-1] TRACE {"Span Id":"b33fdfe6a7eadba1","Tracer Id":"507aeb1eecfbdc794d17f4e75ccb8ab0","Operation":"OPTIONS--/menu","Latency":"44ms","Tags":"{}"}
12:54:29,882 [-] [BatchSpanProcessor_WorkerThread-1] TRACE {"Span Id":"ce4a4b3d6f559c09","Tracer Id":"507aeb1eecfbdc794d17f4e75ccb8ab0","Operation":"PizzaShackAPI--1.0.0--carbon.super","Latency":"50ms","Tags":"AttributesMap{data={span.activity.id=9d6e304a-d212-4d28-be41-86c8603c6560, span.request.path=pizzashack/1.0.0/menu, span.api.version=1.0.0, span.api.name=PizzaShackAPI, span.request.method=OPTIONS, span.resource=/menu}, capacity=128, totalAddedValues=6}"}
12:54:29,883 [-] [BatchSpanProcessor_WorkerThread-1] TRACE {"Span Id":"de8cb3899a718d0e","Tracer Id":"507aeb1eecfbdc794d17f4e75ccb8ab0","Operation":"API:CORS_Request_Latency","Latency":"36ms","Tags":"{}"}
12:54:29,883 [-] [BatchSpanProcessor_WorkerThread-1] TRACE {"Span Id":"a1fd2c399b4889a5","Tracer Id":"728e26aac8a02d5455dfa0b49fa91950","Operation":"API:CORS_Request_Latency","Latency":"0ms","Tags":"{}"}
12:54:34,884 [-] [BatchSpanProcessor_WorkerThread-1] TRACE {"Span Id":"c5306e2887b306aa","Tracer Id":"728e26aac8a02d5455dfa0b49fa91950","Operation":"API:Key_Validation_Latency","Latency":"389ms","Tags":"{}"}
12:54:34,884 [-] [BatchSpanProcessor_WorkerThread-1] TRACE {"Span Id":"281153e5db3b4fdb","Tracer Id":"728e26aac8a02d5455dfa0b49fa91950","Operation":"API:Throttle_Latency","Latency":"8ms","Tags":"{}"}
12:54:34,884 [-] [BatchSpanProcessor_WorkerThread-1] TRACE {"Span Id":"db4b766e53f952ed","Tracer Id":"728e26aac8a02d5455dfa0b49fa91950","Operation":"API:Google_Analytics_Latency","Latency":"1ms","Tags":"{}"}
12:54:34,884 [-] [BatchSpanProcessor_WorkerThread-1] TRACE {"Span Id":"d54215c55916bd0e","Tracer Id":"728e26aac8a02d5455dfa0b49fa91950","Operation":"API:Request_Mediation_Latency","Latency":"1ms","Tags":"{}"}
12:54:34,884 [-] [BatchSpanProcessor_WorkerThread-1] TRACE {"Span Id":"2868d6d916ea4835","Tracer Id":"728e26aac8a02d5455dfa0b49fa91950","Operation":"API:Backend_Latency","Latency":"997ms","Tags":"AttributesMap{data={span.endpoint=https://localhost:9443/am/sample/pizzashack/v1/api/}, capacity=128, totalAddedValues=1}"}
12:54:34,884 [-] [BatchSpanProcessor_WorkerThread-1] TRACE {"Span Id":"f270eb01657f95de","Tracer Id":"728e26aac8a02d5455dfa0b49fa91950","Operation":"API:Response_Mediation_Latency","Latency":"0ms","Tags":"{}"}
12:54:34,884 [-] [BatchSpanProcessor_WorkerThread-1] TRACE {"Span Id":"e46a76de4992f371","Tracer Id":"728e26aac8a02d5455dfa0b49fa91950","Operation":"GET--/menu","Latency":"1426ms","Tags":"{}"}
12:54:34,884 [-] [BatchSpanProcessor_WorkerThread-1] TRACE {"Span Id":"e1a28540ebf22850","Tracer Id":"728e26aac8a02d5455dfa0b49fa91950","Operation":"PizzaShackAPI--1.0.0--carbon.super","Latency":"1426ms","Tags":"AttributesMap{data={span.activity.id=b4bb75d4-d4bc-4331-9475-752d0ae2340b, span.request.path=pizzashack/1.0.0/menu, span.api.version=1.0.0, span.api.name=PizzaShackAPI, span.consumerkey=xTShCMSaKY04lhxY4b0lMfLYHewa, span.request.method=GET, span.resource=/menu}, capacity=128, totalAddedValues=7}"}
Enabling OTLP Tracing
-
Copy the following configuration into the
deployment.tomlfile.[apim.open_telemetry] remote_tracer.enable = true remote_tracer.name = "otlp" remote_tracer.url = "<endpoint-url>" [[apim.open_telemetry.remote_tracer.properties]] name = "<name-of-the-header>" value = "<key-value-of-the-header>"[apim.open_telemetry] remote_tracer.enable = true remote_tracer.name = "otlp" remote_tracer.url = "https://otlp.nr-data.net:4317/v1/traces" [[apim.open_telemetry.remote_tracer.properties]] name = "api-key" value = "<key-value-of-the-header>"Note
Above example illustrates the OpenTelemetry configurations for NewRelic APM.
For Elastic APM the URL can be taken from, Edit Elastic APM integration -> Settings -> General -> Server configuration -> Url after creating an account in Elastic and the name will be "Authorization" and the value can be either "Bearer <Secret-token>" or "ApiKey <Elastic-apm-key>".
Note
The secret token can be taken from Edit Elastic APM integration -> Settings -> Agent authorization -> Secret Token and an Elastic APM key can be created from Menu -> Stack Management > Security -> API Keys -> Create API Key.
Note
For other vendors, please consult the respective documentations.
Using the Custom Tracer Implementation
You can use any tracing server with a custom tracer implementation in MWARE ESB to publish your tracing data. let's implement a custom tracer in MWARE ESB for it using the instructions given below:
Implement the org.wso2.carbon.apimgt.tracing.telemetry.APIMOpenTelemetry interface and add your implementation. The following are the methods that the APIMOpenTelemetry interface uses to carry out various related operations.
| Method | Description |
|---|---|
| init | Provide the service name to this method as a parameter and configure an instance of OpenTelemetrySdk. |
| getAPIMOpenTelemetry | Returns the initialized OpenTelemetry instance. |
| getTelemetryTracer | Returns the initialized tracer instance. |
| getName | Returns the name of the type. |
| close | Shutdown the SDK cleanly at JVM exit. |
For more information view manually instrumented Jaeger tracer.
-
Build the Maven project and add the JAR file to the
<API-M_HOME>/repository/components/dropinsdirectory. -
Add the following configuration into the deployment.toml file.
[apim.open_telemetry] remote_tracer.enable = true remote_tracer.name = "<custom-tracer-name>" -
Add any external JAR files to the
<API-M_HOME>/repository/components/libdirectory if required. -
Start the server.